


In a record-setting summer, WeatherLink answers: "How hot is it?"
Over recent summers, global temperature records have been matched and broken at an alarming rate. Last year, 2022 tied 2020 as the hottest summer since reliable records begin in the 1850s. This year has already seen the hottest global June of all time and several record-breaking heatwaves across both the Eastern and Western hemispheres. The first week of July saw a three-day stretch that some researchers believe to have been the hottest such timeframe in the modern history of our planet.
If you're looking for an interactive resource you can use to make the story of record-setting global temperatures extremely visual, look no further than the WeatherLink temperature map!
The public WeatherLink network is made up of more than 170,000 Davis Instruments weather stations around the globe, including more than 60,000 in the United States. Each of those users has made their real-time station data available for community use and study. The numbers in the circles on the map below represent regional station counts in areas of network density:

Here are two examples of key insights and intriguing data stories WeatherLink users have been able to visualize just during the week of July 16, 2023:
Near-record temperatures in the American Southwest
On July 16, the greater Death Valley area experienced some shocking high temperatures, missing the world record of 129°F by just a single degree. Two days later on July 18, a Davis weather station was still reporting local temperatures of 122°F near the Nevada side of the park.

About 400 miles south, a Davis weather station near Yuma, Arizona was still reporting unrelenting temperatures of 113°F around midday, more than five degrees above the historic average for that day.

Over 1,000 miles east in Fort Worth, Texas at the same time, a Davis station measured 110°F, several degrees above the previous local record for that day (106°F) and well above the historic average of 96°F.

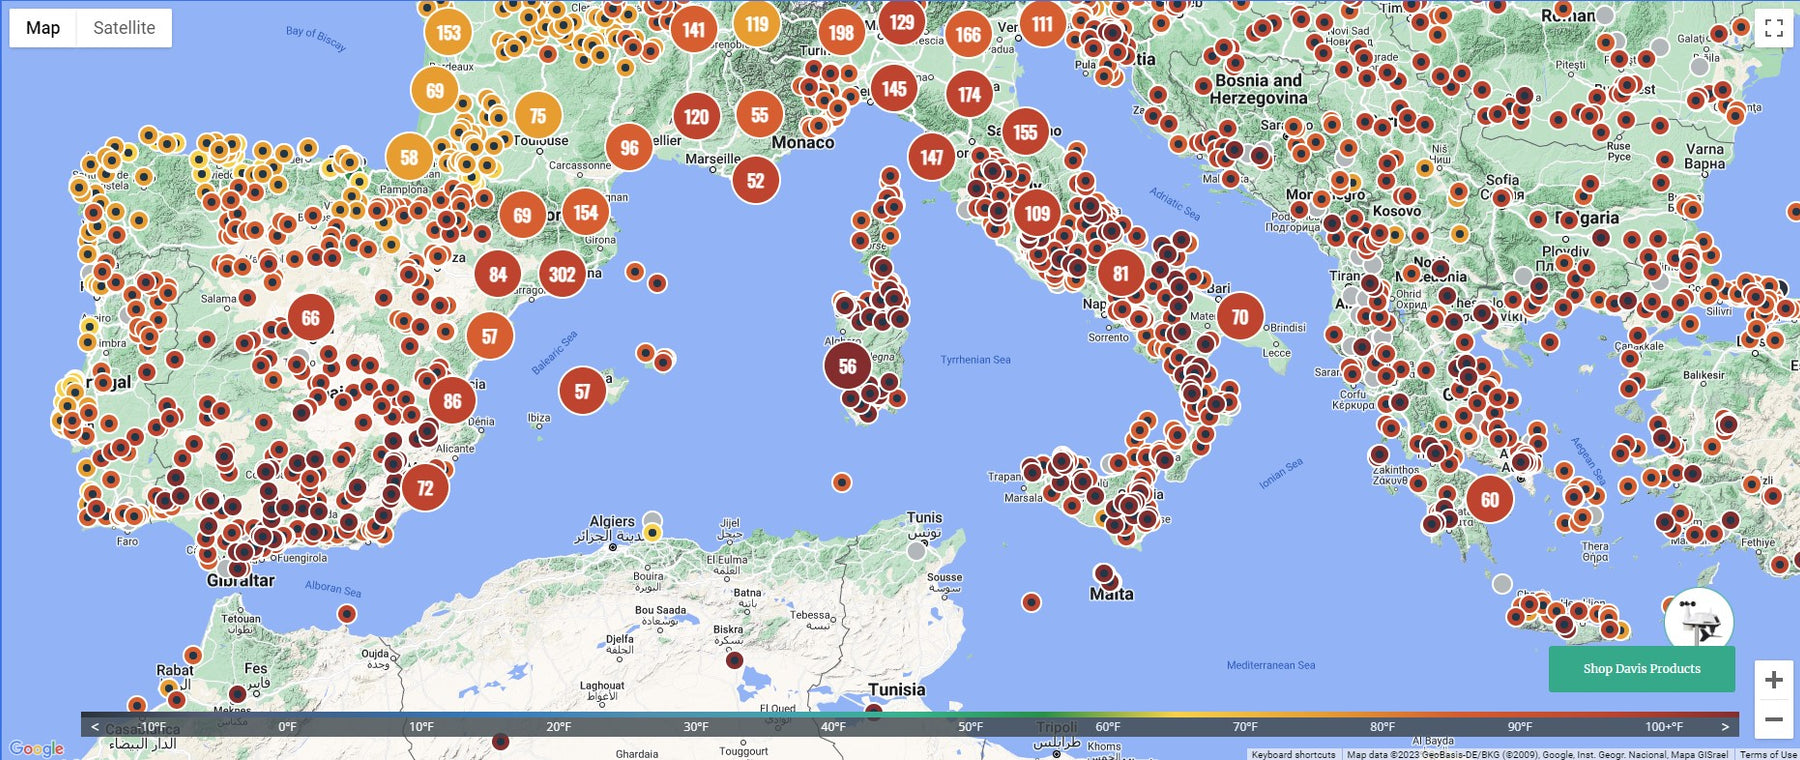
Major Mediterranean heatwave
This week was a scorcher across the Mediterranean as well. The image below was captured around midday on Wednesday, July 19. Each maroon circle below represents a station reporting a temperature over 100°F, with each red dot representing at least 90°F.

The modern European temperature record of 119.8°F was set on the island of Sicily back in August of 2021. This week, Sicily was consistently tripping in the triple digits, including this 107°F at a dump in the Marsala area on Wednesday.

At the exact same time, a Davis station in Algeria reported a 115°F reading near Biskra, Algeria, paired with a bone-dry 9% humidity, illustrating the generalized effects of the heatwave throughout the Mediterranean.

Join the WeatherLink family for more insights
If you're looking to study weather, either in your local area or on a global scale, Davis Instruments and WeatherLink are here to help.
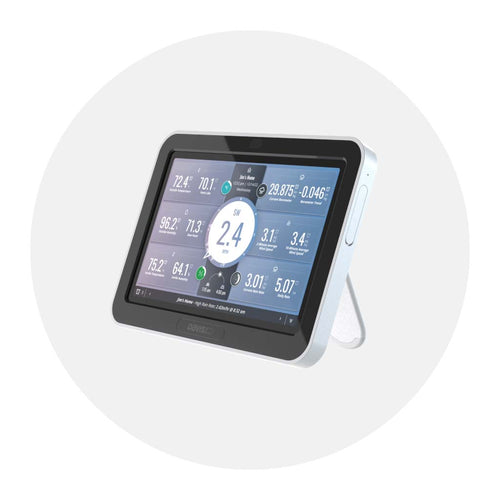
Our easy-to-install weather stations allow you to start gathering data about temperature, humidity, precipitation, air quality, and beyond with scientific accuracy. The cloud-based WeatherLink software makes it easy to view data from your station in real time and study historic readings and trends your equipment has captured. As a Davis user, you can also make your station data public so that it's available for other weather enthusiasts and scientists to view through the WeatherLink map.
If you're ready to get serious about the weather and join a community of likeminded people, it's time to put yourself on the WeatherLink map!
![]()
In the face of escalating environmental risks, AEM is the essential source for insights on weather, climate, lightning, floods, wildfires, water management, and more.
Learn more about AEM and all of our solutions here.