
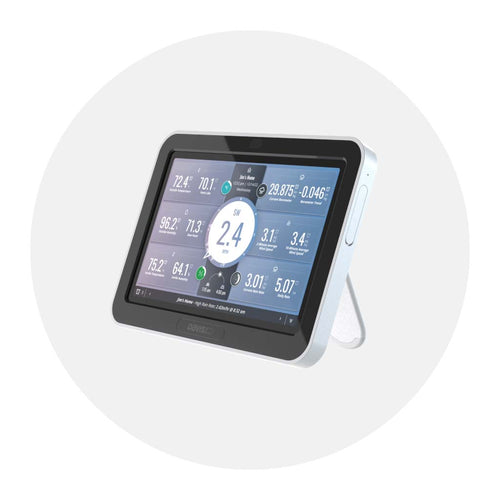
WeatherLink Console Update Increases Dashboard Customization & At-a-Glance Data Insights
We’re pleased to announce the release of our new firmware update for the WeatherLink Console on February 7, 2024. No user action is required as part of the Version 1.4 release, which comes one year after the console first debuted at CES 2023. The update will be pushed to devices from the Davis side, and users will receive a pop-up confirmation message directly on the console.
This article is for current WeatherLink Console users who want to get the most out of the product’s emerging customization features and have some input on the direction of the product (hang on until the end for that!). If you’re not a WeatherLink Console user yet, you can learn more about becoming one here.
What’s new in version 1.4?
Our latest firmware update for the WeatherLink Console is all about quality-of-life improvements that have been driven by feedback from the WeatherLink community.
You said it would be powerful to get air quality reports on the console, so we added that. You wanted a deeper understanding of how individual rain events contribute to yearly totals, so we added that. You said you wanted more insights into hyperlocal wind events, so we added that. Here’s a quick breakdown of the WeatherLink Console’s new functionality:
Storage space optimization
We wanted to make it easier for you to store data long-term on the console while ensuring there’s always room to provide a high degree of detail for real-time and recent readings, so we’ve optimized storage space on the device. Any data older than 180 days will be compressed into hourly data. If you’re using your WeatherLink for ongoing weather study, be sure to regularly upload data to the cloud to archive your most detailed readouts.
Visualize indoor air quality data from your AirLink
Using the Graph tab, you can now visualize air quality index (AQI) and particulate matter (PM) air pollution readings, averages, highs, and trends over specific time periods.
|
|
|
Example WeatherLink Console air quality graph
|

To learn more about graphing tools within the WeatherLink Console, please refer to page 14 of the WeatherLink Console User Guide.
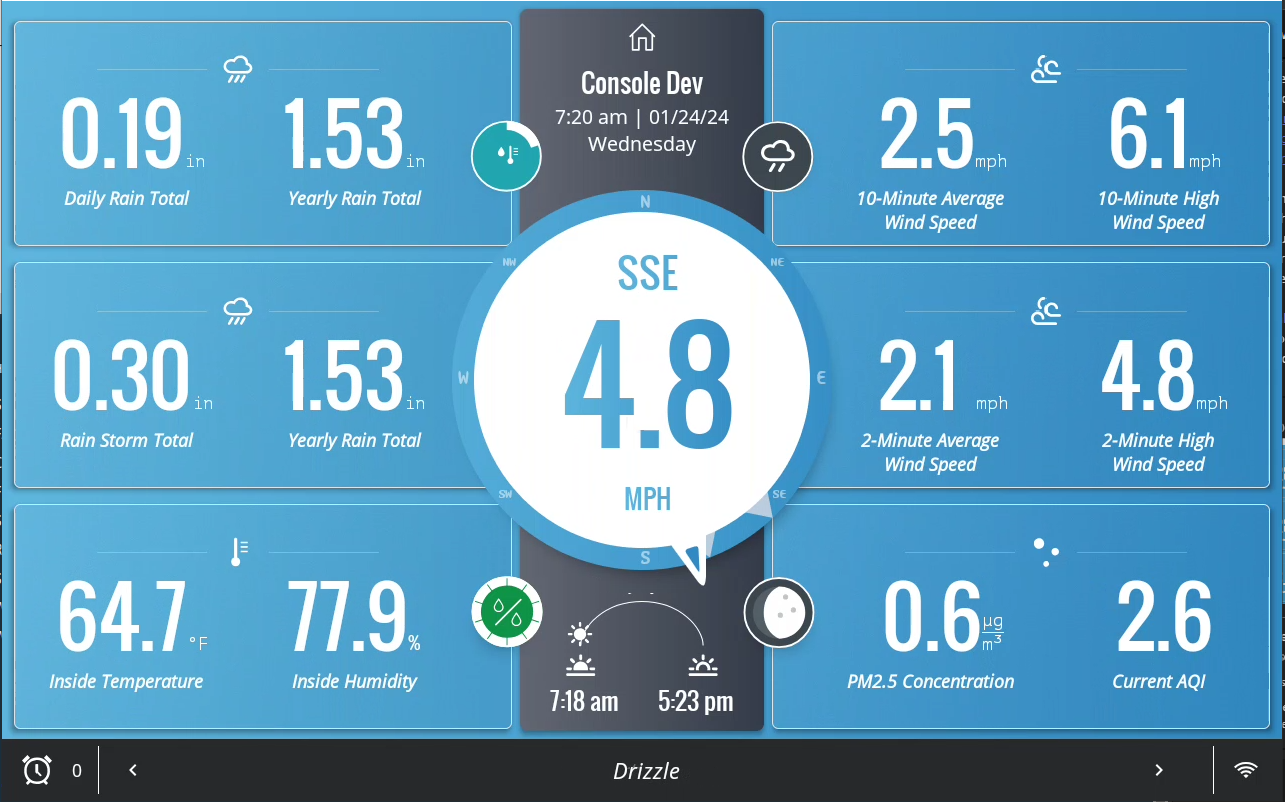
New dashboard tiles
The new Weather Console firmware update adds four new data insights that you can include as part of your personal weather dashboard display:

- Daily rain/Yearly rain: Track how today’s rainfall contributes to your yearly total
- Storm total/Yearly total: Quantify a heavy storm’s impact by comparing it to yearly rainfall totals
- 10-minute wind/10-minute high: Monitor average and peak speeds during major wind events
- 2-minute wind/2-minute high: Measure average and peak wind speeds in near-real time
How to customize the tiles on your WeatherLink Console dashboard
The WeatherLink Console offers an extensive range of customization options for your dashboard, featuring a multitude of data parameters. To select the insights that you’d like to see at a glance, just follow these easy steps directly on the console itself:
- Tap the “Account” symbol in the upper righthand corner
- Tap “Customize Display” in the lefthand menu
- Select either the 3x2 layout (for maximum insights) or the 2x2 layout (for maximum readability)
- Select whether you prefer High Contrast Mode on or off
- Tap the “Customize Display” button in the upper righthand corner to save your choices and proceed to the tile and bubble options page
- Select the data points you would like to see on your dashboard. The selected insights will populate in order starting with the upper lefthand tile. For each insight, confirm you are drawing data from the correct source sensor and click “Save”
For a more complete breakdown, please refer to pages 15-16 of the WeatherLink Console User Guide.
What weather insights can I add to my Weatherlink Console?
As of the Version 1.4 release, there are officially more than 90 different datapoints you can put on the WeatherLink Console dashboard for your own ongoing study, to keep you up to date on potential weather safety information, or to help you make household decisions around the weather.
We’re not just talking about real-time sensor readings from your weather station – that’s table-stakes stuff. The WeatherLink Console dashboard provides packaged insights that take your understanding of the weather to the next level. With up to 12 customizable tiles and four selectable bubbles, the number of ways you can present and digest data is nearly endless. Here’s just a preview of the current menu of data points you can add to your personal dashboard:
- Temperature: 5 insights
- Temperature/Humidity: 24 insights
- Wind: 10 insights
- Barometric pressure: 6 insights
- Rain: 19 insights
- Solar radiation/UV index: 9 insights
- Soil moisture/Leaf wetness: 13 insights
- Air quality: 6 insights
- Current daily forecasts: 4 insights
What weather insights would you like to see added to your personal dashboard?
Have an idea for a tile, report, or data view that you’d like to see added to the WeatherLink Console? With over 90+ possible configurations at your fingertips, we're continually looking to expand and enhance your experience.
Your input is invaluable to us – we'd love to hear about any specific combinations you'd like to see added. Please share your suggestions by clicking this link. Thank you for helping us improve!
![]()
In the face of escalating environmental risks, AEM is the essential source for insights on weather, climate, lightning, floods, wildfires, water management, and more.
Learn more about AEM and all of our solutions here.